Jul 2021
All you need to know about the iBoard
Datanumia specialises in energy performance for businesses and public organisations. It has developed the iBoard to simplify the analysis of energy efficiency.

Defining the iBoard, Datanumia's energy dashboard
Online dashboards in the cloud have become essential organisational and decision-making tools in a number of fields. Because they are designed for ease of use and are automated through data processing, they are particularly well-suited for energy performance.
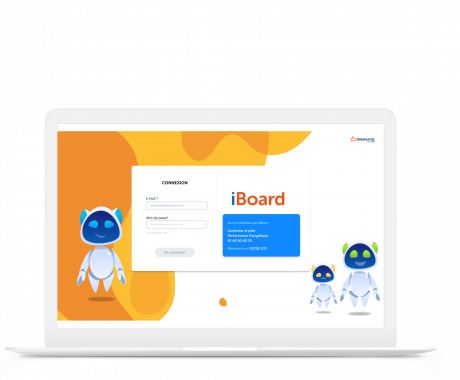
This is why Datanumia designed the iBoard, a multifactor dashboard, providing businesses and public organisations with clear and relevant information about their consumption, item by item. Consumption can be managed with this dashboard as well as the CSR strategy, audits, the tertiary decree and the ISO 50001 standard.
Datanumia specialises in energy performance for businesses and public organisations. It has developed the iBoard to simplify the analysis of energy efficiency. The visualisation options offered by this tool are both simple and precise and are available on all sorts of devices, turning into an energy efficiency hub for companies and public organisations.
What are the features of the Datanumia iBoard?
Datanumia's iBoard is an online energy management platform. It provides detailed studies and the monitoring of energy consumption, all in an effort to reduce expenditures. Its large range of smart energy functionalities adapt to the size of your organisation. Whether you are monitoring one or several sites, everything is centralised in a single tool.
This therefore simplifies access to your consumption data, allowing you to follow all of your energy outputs and to be alerted in the case of waste or of a breakdown.
The iBoard works in the following way:
The site(s) that are monitored
This menu gives access to a map or to a table, depending on the visual representation you wish to have. You can therefore view each of your sites directly or you can group them by region or type. Offices, warehouses and shops can, for example, be differentiated.
You can also use a certain number of filtering options by selecting building specificities, energy type or greenhouse gas emissions.
On the right side of the page, a summary lists all energy and fluid consumption statistics and provides air quality indicators. And that is done for all of your physical sites. You can even receive a ranking of CO2 emissions for each place.
This section also allows you to add documents such as reports, invoices, and even technical documents and contracts.
What are the advantages of the iBoard?
The benefits of an energy dashboard such as Datanumia's iBoard are numerous for the tertiary sector, for land tenure and for the industrial sector. By being continuously informed of your buildings' consumption, you become aware of the building’s impact and can then find tangible ways to minimise it.
As for industries, they can optimise the management of their industrial processes while also reducing their energy consumption.

Corporate social responsibility can therefore happen in a precise manner and on a daily basis. Ways of improving it can then be engaged.
With the iBoard, you can also view the impact of key performance indicators linked to the tertiary sector decree and to the ISO 50001 standard.
This helps you attain your objectives and meet your obligations more efficiently. An Energy Manager can help you define your objectives and obligations through a comprehensive diagnosis outlining your baseline consumption and presenting the savings to which you can aspire through a custom strategy.
Last news


